©2022-2026 Deplancke lab, EPFL, 1015 Lausanne
Filters
| By genomic position | |
| Variant impact | |
| Gene name |
| Involved in binding site | |
| Binding site |
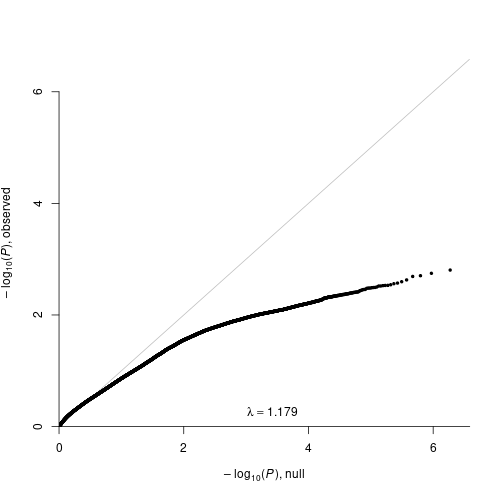
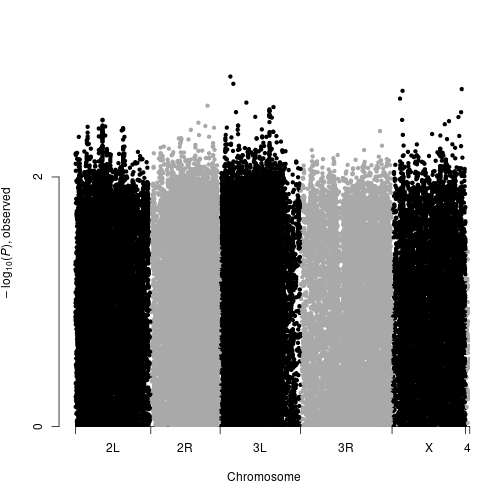
GWAS results were computed on dm3 genome.
If you want to make an independent analysis with DGRP2 or PLINK2, you can find here prepared input files for this phenotype:
DGRP2 results
PLINK2 results
Phenotype distribution and association to known covariates
Shapiro-Wilk test of normality (p-value=4.365e-25)
Null Hypothesis is rejected (p<=0.05).
Interpretation: NOT NORMAL distribution of this phenotype
Null Hypothesis is rejected (p<=0.05).
Interpretation: NOT NORMAL distribution of this phenotype
We tested for association of this phenotype with 6 known covariates Huang et al., 2014 using
both ANOVA and Kruskal-Wallis association tests.

